Charts
Interesting Statisics in the New Testament
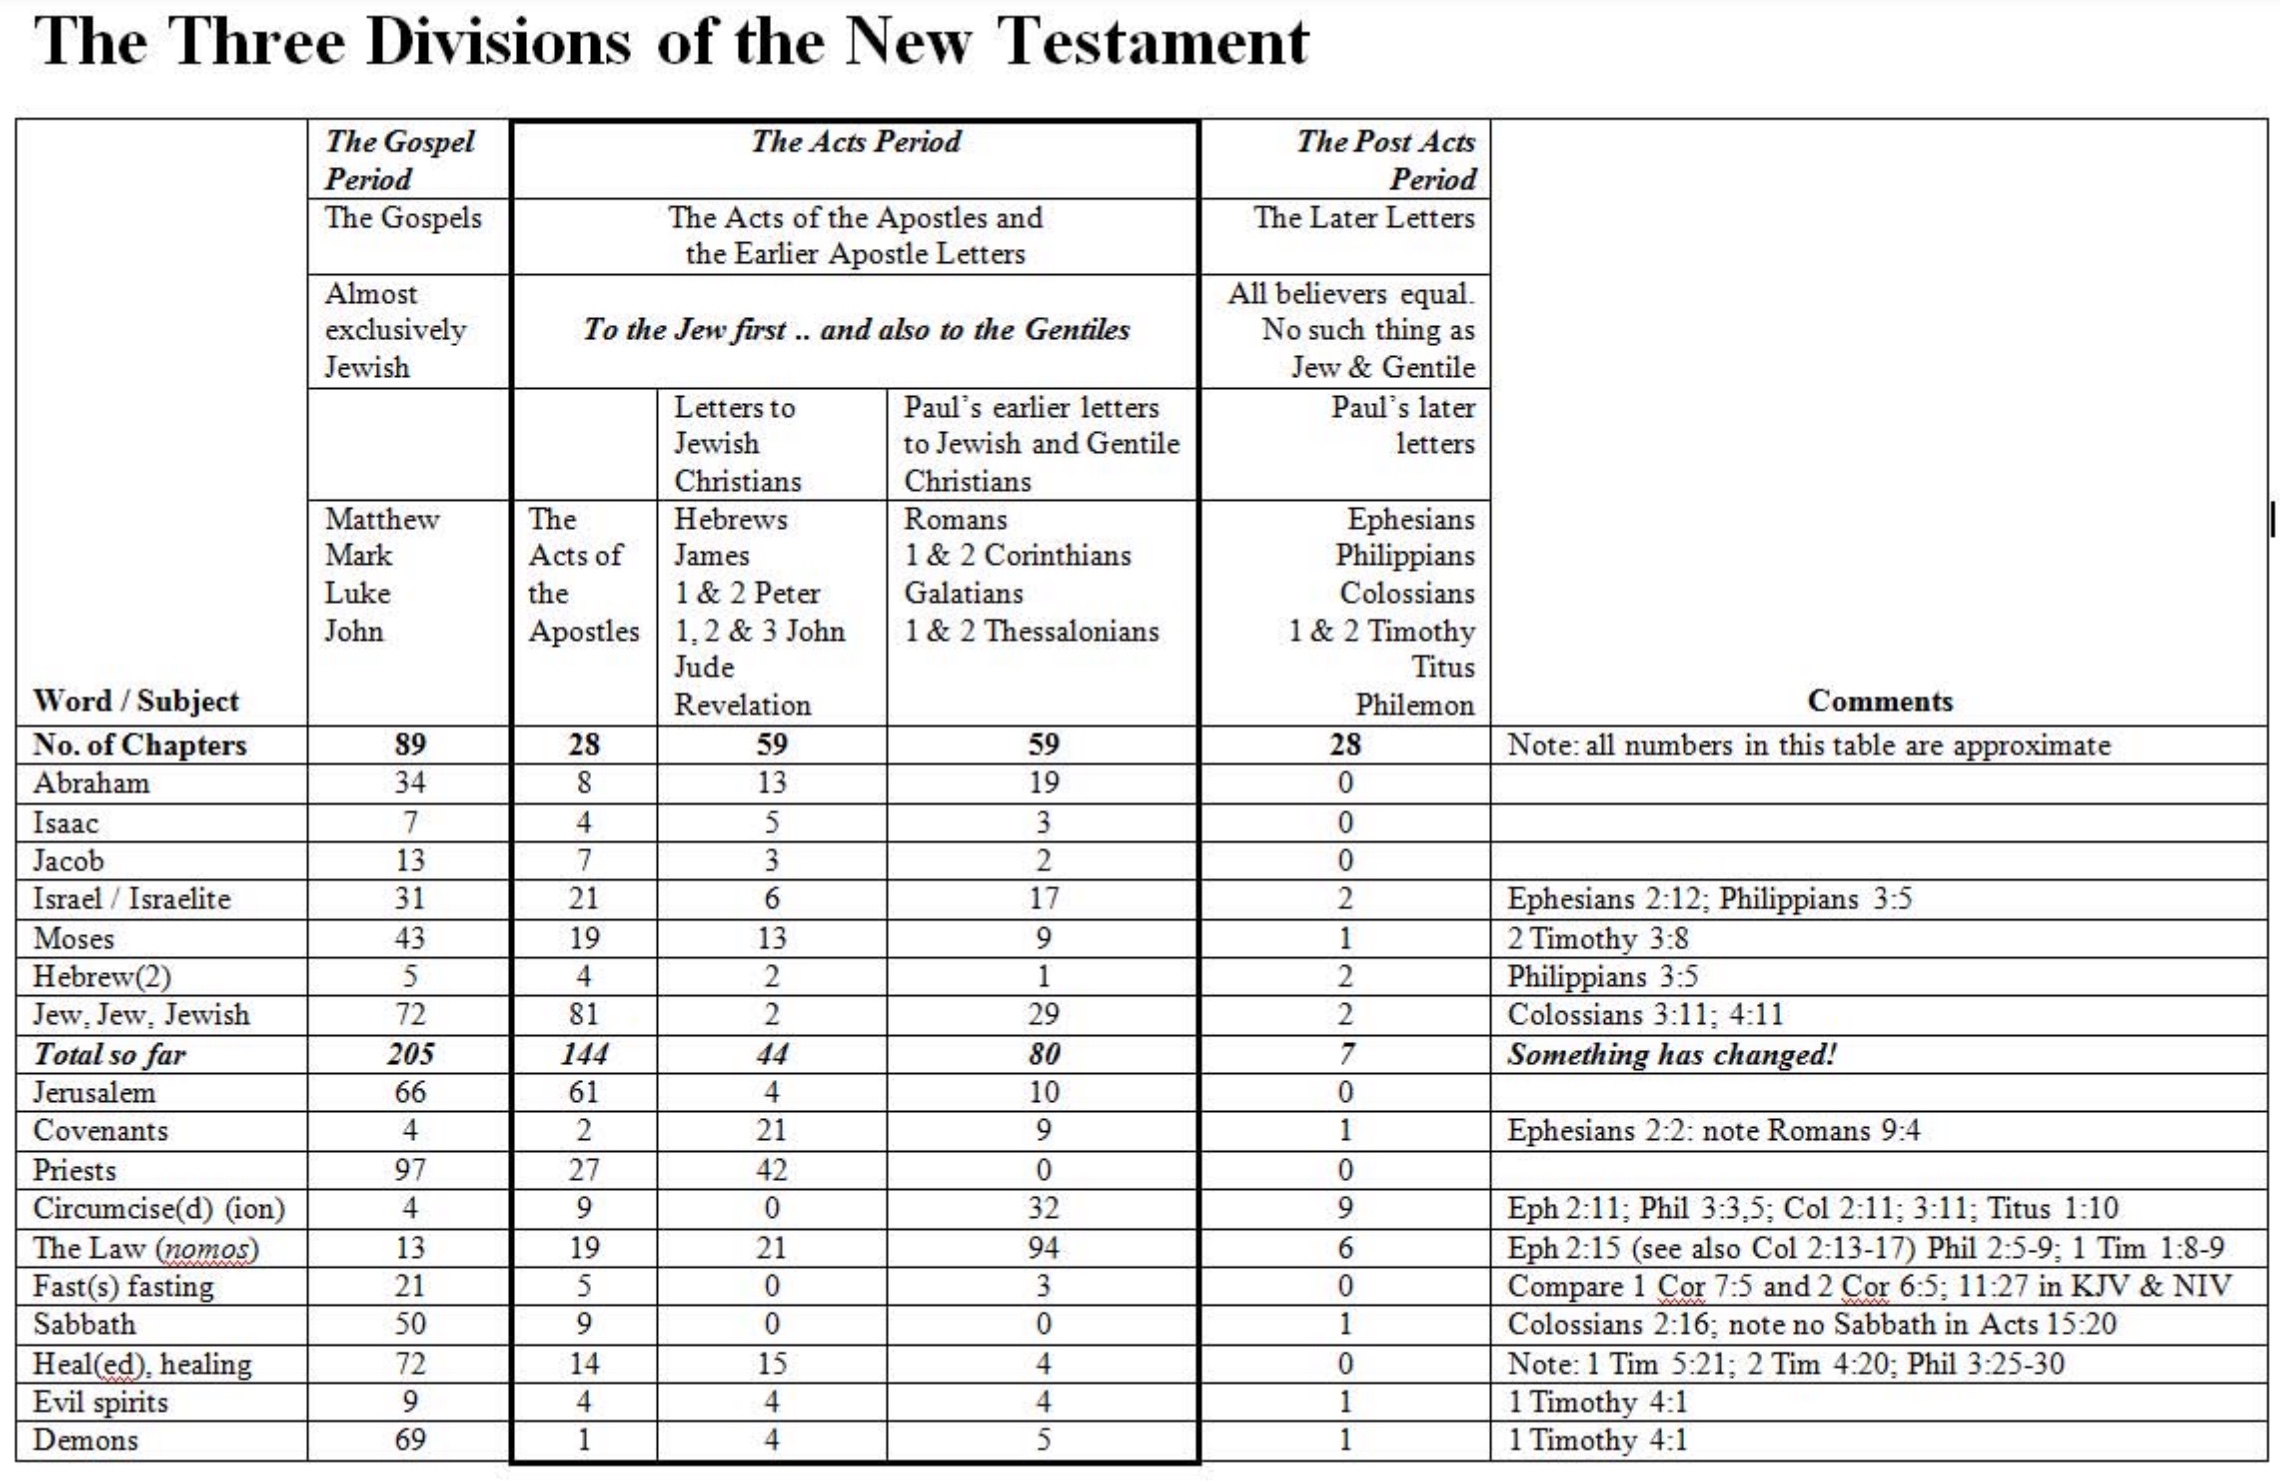
This chart was presented by Mike Penny during his October 2009 seminar on Numbers in the New Testament. It looks at the number of occurences for topics in the Gospel Period books, the Acts Period books and the Post Acts Period books and shows when something has changed statistically speaking. This is a great way to look at dispenstional changes by seeing how some topics are not present in the Post Acts period books of the Bible.
Interactive Chart
How to use
Use the buttons above the chart to zoom and pan. Click the lock button to lock the chart in place. Click the reset button to reset the chat to its original spot. Click and drag with your mouse to pan.